
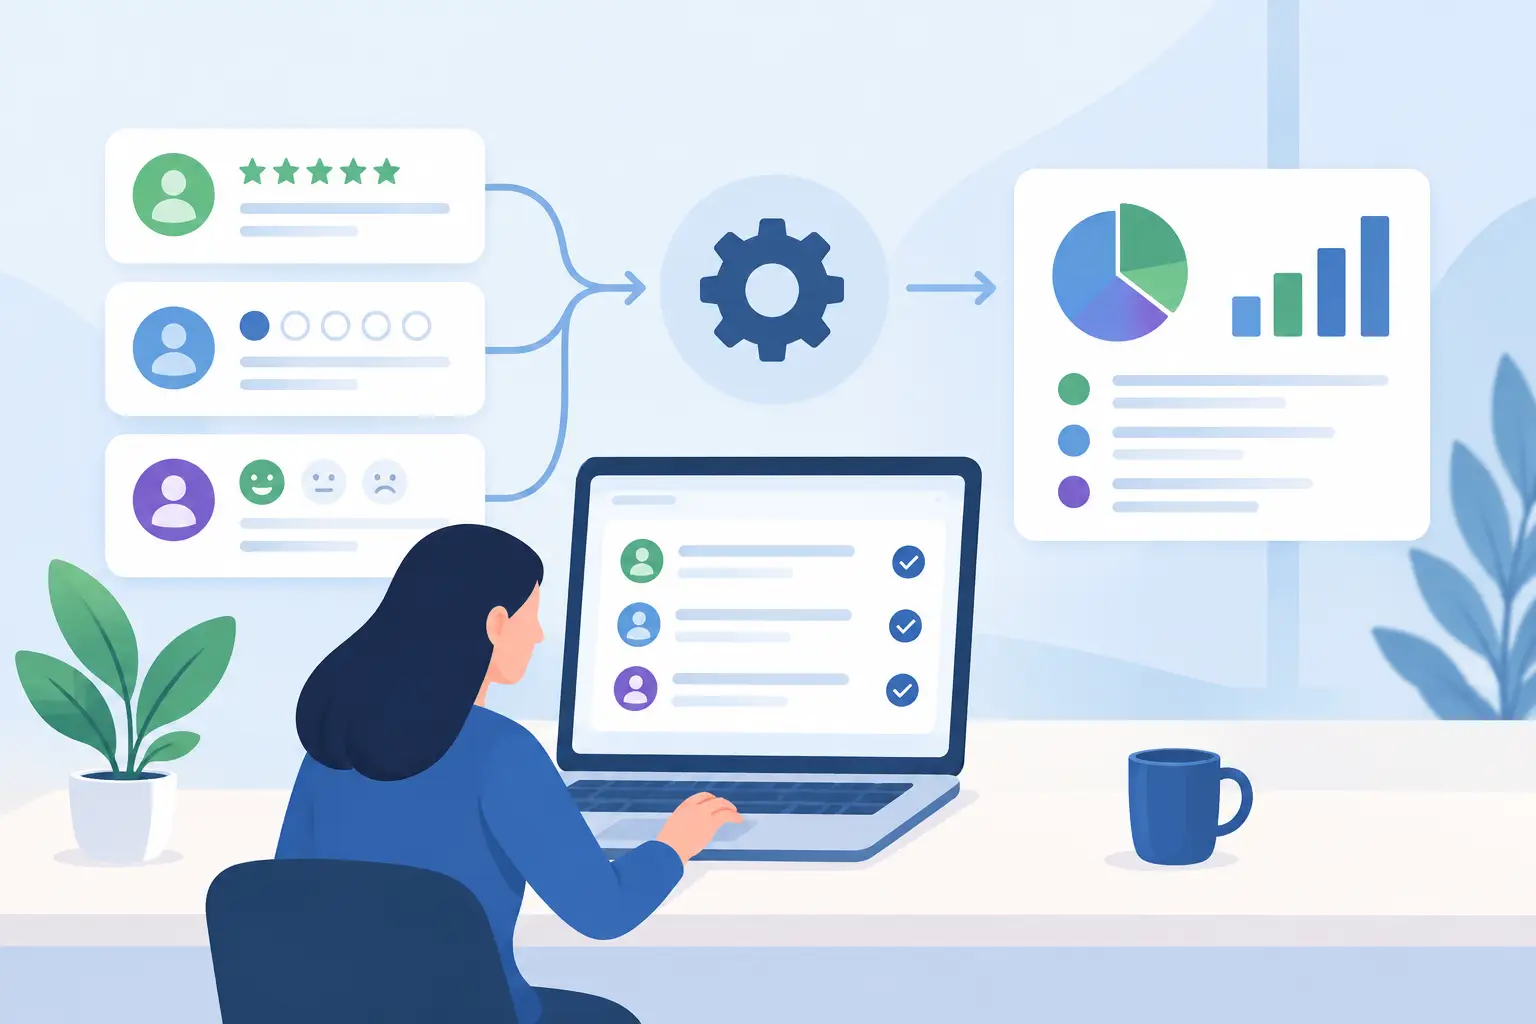
A survey response management system is not simply a place to store completed questionnaires. For organizations receiving thousands of customer, employee, service, or stakeholder comments, it is the operating layer between feedback collection and operational improvement. It determines whether responses become evidence for a decision or remain another unread export in a shared folder.
The distinction matters most when survey data is only one part of the feedback picture. A low satisfaction score may be explained by open-text comments, recent complaints, service emails, work-order notes, or a change in a specific location. If those sources sit in separate systems, teams spend more time reconciling data than improving the experience behind it.
What a Survey Response Management System Should Do
A useful system manages the full response lifecycle: collection, organization, analysis, triage, action, and follow-through. Survey building is part of that lifecycle, but it is not the whole job.
At the collection stage, the system should preserve the context needed to interpret a response. That includes respondent attributes, survey version, distribution channel, date, location, account, product line, and relevant operational events. A score without context can signal a problem. A score connected to the right context can show where the problem starts.
Once responses arrive, teams need a consistent way to organize both structured answers and unstructured text. Closed-ended questions can be grouped by segment, trend, and performance threshold. Open-ended comments need classification into themes, drivers, sentiment, issue types, and root-cause categories. Manual review still has value, especially for sensitive or unusual cases, but it should not be the only method for finding recurring patterns.
The operational test is simple: can a manager move from a declining metric to the comments, cases, and conditions behind it, then assign a specific next step? If not, the organization has survey reporting, not response management.
Why Survey Dashboards Alone Fall Short
Dashboards are valuable because they make patterns visible. They are not enough because visibility does not create ownership.
Consider a service organization whose post-interaction survey score falls in one region. A dashboard can identify the region, the period, and the affected service category. The next questions are harder: Which comments describe the experience? Is the issue caused by scheduling, communication, technician conduct, repeat visits, or billing? Does the complaint volume support the same finding? Who will investigate, and when will leadership know whether the corrective action worked?
A standalone survey tool often leaves those questions to spreadsheets, meetings, and individual follow-up. A generic business-intelligence tool may visualize the data well but require significant preparation before qualitative feedback can be analyzed consistently. Neither approach necessarily creates a controlled path from feedback to action.
A feedback intelligence platform closes that gap by bringing survey responses together with related operational feedback, applying a shared classification structure, and creating an Action Backlog for accountable work. The value is not merely a better chart. It is a repeatable decision process.
The Core Capabilities to Evaluate
The right requirements depend on response volume, data complexity, and how distributed accountability is across the organization. A small research team may prioritize flexible survey design and project-level analysis. A multi-location service business may need integrations, role-based access, workflow controls, and location-level accountability.
Still, a capable survey response management system should support several connected functions:
- Response capture and respondent management that retains survey metadata, contact history, consent requirements, and segmentation attributes.
- Open-text classification that organizes comments into consistent themes and root-cause categories without forcing teams to read every response from scratch.
- Connected data sources that bring in complaints, emails, case notes, work orders, and customer-experience records alongside survey data.
- Guided analysis and dashboards that help users move from a score or trend to the underlying evidence.
- Action tracking that assigns owners, due dates, status, and expected outcomes to improvement work.
- Shareable insight views that give executives and operational leaders a common view of the issue without distributing uncontrolled spreadsheet versions.
The most significant capability is the connection between these functions. A platform can have sophisticated text analytics and still fail operationally if findings cannot be reviewed, assigned, and tracked. It can also have excellent workflow features but produce weak actions if the underlying feedback has not been organized into credible, reviewable evidence.
Build Around Decisions, Not Survey Questions
Many survey programs begin by debating wording, scales, and survey length. Those decisions matter, but they should follow a more practical question: what decision will this feedback support?
If a customer-experience team needs to reduce repeat service visits, the survey should capture the elements that can distinguish likely drivers: communication before arrival, timeliness, first-time resolution, professionalism, and clarity of the outcome. The response management process should then connect those answers to service records and open comments.
If an employee-experience team is assessing manager effectiveness, anonymity, minimum reporting thresholds, and segmentation rules become central. The system must protect confidentiality while still allowing leaders to see actionable patterns. More detailed reporting is not always better if it creates a risk of identifying individual respondents or encourages unreliable conclusions from very small groups.
This decision-first approach prevents a common failure mode: collecting broad sentiment data that produces interesting observations but no clear owner, intervention, or measure of success.
Preserve a stable classification model
Open-ended responses are where much of the operational value resides, and where inconsistency can quietly undermine analysis. If one analyst labels a comment “communication,” another uses “updates,” and a third uses “expectations,” trend comparisons become weak.
Create a controlled classification library with definitions, examples, and rules for when categories apply. Use a hierarchy when needed, such as Service Experience, Appointment Management, and Late Arrival. Keep the model stable enough to measure change over time, while allowing governed additions when new issues emerge.
Root-cause analysis should go beyond surface topics. “Long wait” identifies an experience. “Capacity planning,” “handoff delay,” or “parts availability” may identify the operational condition that produced it. The right level of detail depends on whether a team needs to monitor a trend, diagnose a process, or assign corrective work.
Turn Findings Into Managed Work
Feedback becomes useful when it changes a decision, a process, or a behavior. That requires a visible handoff from analysis to execution.
For each material finding, document the evidence, affected population, suspected driver, action owner, due date, and success measure. The success measure should be connected to the problem. If comments show confusion after a service visit, the response may be a revised closeout process. Success could be fewer confusion-related comments, improved clarity scores, reduced follow-up contacts, or a combination of these measures.
Avoid treating every negative response as a separate task. Individual recovery cases may require direct outreach, but systemic improvement requires grouping similar feedback and prioritizing by frequency, impact, risk, and strategic importance. A single serious complaint may deserve immediate escalation. A recurring moderate issue may deserve a larger process change. The system should support both paths.
StatQuestions is designed around this connected model, combining survey data with other organizational feedback and carrying validated findings into guided analysis, root-cause libraries, and an Action Backlog. That structure helps teams preserve the link between what people said and what the organization decided to do.
Measure Whether the Management Process Is Working
Survey completion rate and average score are useful, but they do not measure whether an organization manages responses effectively. Add operating measures that reveal the health of the feedback process.
Track the time from response receipt to classification, the share of material issues reviewed within a defined service level, the percentage of priority findings with an assigned owner, and the aging of open actions. Review whether completed actions produce movement in the targeted experience measure or operational indicator.
Be careful with attribution. A higher score after an initiative does not automatically prove the initiative caused the improvement. Seasonality, respondent mix, policy changes, and sample size can all affect results. Compare relevant segments, review the qualitative evidence, and look for supporting operational signals before declaring success.
Start With One High-Value Feedback Loop
Organizations do not need to centralize every survey and data source on day one. Begin with a feedback loop where the business cost of inaction is clear, such as service complaints, customer churn signals, onboarding friction, or employee turnover risk.
Define the decision, connect the necessary sources, establish classification rules, and create a review cadence with named owners. Once the process produces trusted findings and completed actions, expand it to additional surveys, teams, and feedback channels.
The goal is not to create more reports about what respondents think. It is to give the people closest to the work a disciplined way to see the evidence, identify the cause, and make the next action visible.